
Municipal Climate Tool
Builds a municipality's greenhouse-gas inventory from its own activity data, then projects it forward under measure scenarios so a climate plan has an arithmetic base rather than an aspiration.
Decision supported
Which measures a municipality should fund first, what they add up to against its target, and whether the target is reachable at all on the current trajectory.
Intended user
Municipalities, municipal energy and environment offices, and the donor programmes financing local climate plans.
Inputs
- Activity data by sector — stationary energy, transport, waste, AFOLU
- Population and, where available, building stock
- Local tariffs and fuel prices
- Existing measures already committed or under way
- The target and target year the plan has to meet
Outputs
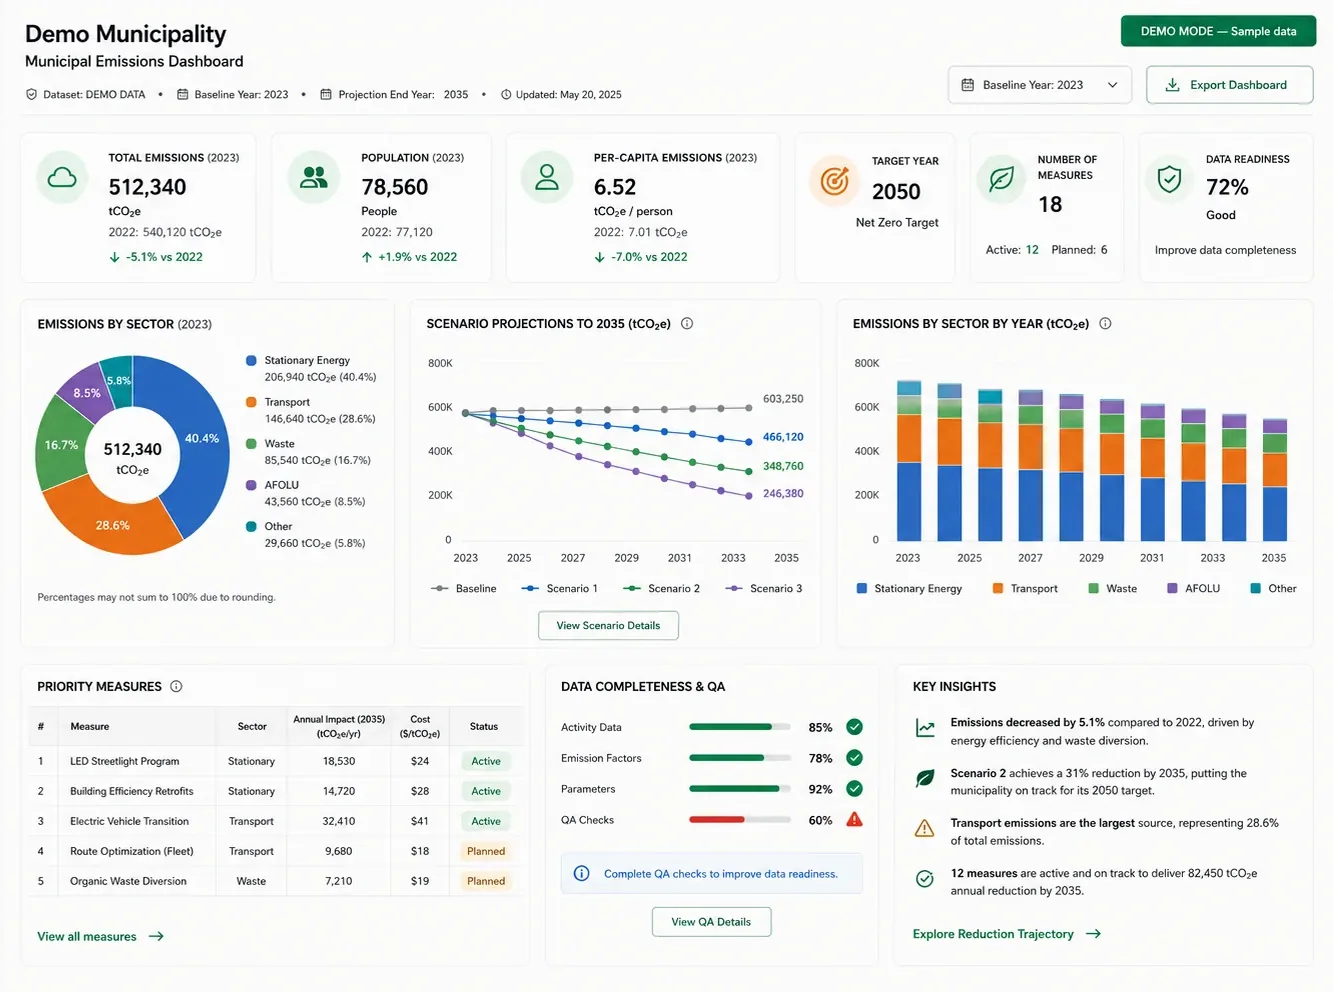
- Baseline inventory by sector, with completeness scored per data category
- Scenario projections to the target year
- Measures ranked by annual impact and cost per tonne
- QA panel showing which inputs are measured, estimated or defaulted
- Exportable inventory and reporting pack
Methodology summary
IPCC-consistent sectoral accounting with an explicit data-quality layer: every figure is marked measured, estimated or defaulted, so a reader can see which parts of an inventory are evidence and which are assumption. Scenarios are built from named measures rather than a headline percentage, which is what makes a plan implementable rather than declarative.
Limitations
- An inventory is only as good as the activity data behind it. Where a municipality has none, the first output is a data-collection plan, not a number.
- Projected reductions are ex-ante estimates of measures as designed. What is actually delivered depends on procurement, budget and operation, none of which the model controls.
- Municipal boundaries rarely match utility or transport network boundaries. Attribution at the edges is a judgement, and it is documented as one.
Screenshots
Access model
Applied within a municipal transition engagement. The inventory and its assumptions are handed over so the municipality can update it in subsequent years without re-commissioning the baseline.
Request a demonstration
Tell us the context, timeline and decision you're working toward.
Request a demonstrationWe reply within two business days.